Layer Symbology
Layer Symbology is the styling panel on the 1.1.7 Island Bar (Right Bar) for the active map layer. Configure sub-layers, paint rules, legends, and geometry-generated (gg) types such as extruded floors.
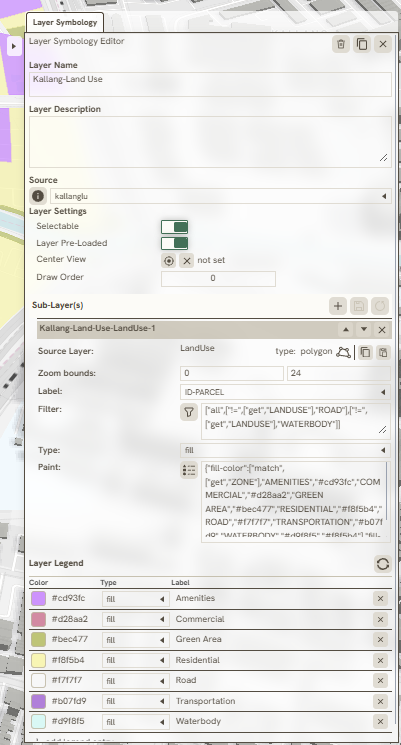
Located on the 1.1.7 Island Bar (Right Bar), the Layer Symbology panel manages layer identity, data source properties, visual styling, and legend configurations through the following components:
-
Layer Name: Modifies the display name of the layer within the interface.
-
Layer Description: Allows the input of a concise summary detailing the layer's purpose or contents.
-
Source: Manages the underlying data source connection and controls pre-load configurations, including:
-
Selectable: Toggles whether features within the layer can be interactively selected.
-
Layer Pre-Loaded: Determines if the layer loads automatically upon opening the project.
-
Center View for Bounds: Zooms and centers the map view to the geographic extent of the layer.
-
Draw Order: Sets the rendering hierarchy to control which layers appear on top of others.
-
-
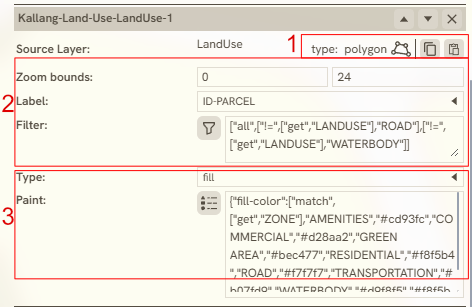
Sub-Layer(s): Serves as the primary utility within this panel, used to configure and customize the layer's visual styling and symbology.
-
Layer Legend: Generates and formats the map legend entry for the layer to assist with map readability.
Sub-Layer(s)
Structurally, a single parent layer can contain multiple sub-layers, each maintaining its own distinct visual style.
To manage GIS symbology effectively, these sub-layers categorize geometric data by feature type (points, lines, or polygons). The styling properties are then customized individually for each category to ensure clear visual differentiation on the map.
- This panel includes a styling function designed to Copy Visual styles and apply them directly to other layers that share the same geometry type and attribute. Additionally, a Delete Function is available to permanently remove unwanted sub-layers from the configuration.
- Layer Filtering is filter function that isolates pre-loaded layer features based on a specific reference value within the layer's attribute data.
- Paint Properties is a styling utility used to create, configure, and manage the visual properties and rendering rules of the layer.
The Paint Properties utility features five distinct coloring methods to style layer attributes:
-
Constant: Applies a single, uniform color across all features in the layer regardless of their attribute values.
-
Category: Assigns unique colors to distinct qualitative values or classes within a specific attribute column, ideal for nominal data like land use zones or administrative regions.
-
Graduated: Divides continuous numerical data into discrete ranges or bins, applying a progressive color ramp to illustrate rank or magnitude, such as population density tiers.
-
Interpolated: Creates a smooth, continuous color transition across a range of numeric values, mapping each unique value directly to a specific point on a color gradient.
-
Property: Binds feature colors directly to a dedicated attribute field that contains explicit color codes, such as hex tokens or RGB values, stored within the dataset itself.
For more detailed style/paint, please visit this website: Layers - MapLibre Style Spec
Paint Properties configurations are determined by the underlying geometry type:
A. Polygon
There area several examples of polygon that commonly used in the projects:
- Constant
- Category This function requires the selection of a specific reference point, using the "ZONE" data attribute as the pivot key in this example, and features a dropdown menu to easily access and select the desired key without manual typing.
- Geometry Generated (gg) extrusion for Vertical Zoning
Use a geometry-generated sub-layer type such as gg_fill-extrusion-floors to extrude polygons by floor count, floor height, and space-type color. See Vertical Zoning & Extrusion for configuration details and how derived metrics appear in the Expression Syntax Helper.
B. Polyline
While shape styling/painting remains generally similar, polyline features include a unique line-dasharray function. In this example, the input values 2 and 4 configure the pattern by setting the painted dash length to 2 units and the empty gap length to 4 units, repeating this sequence continuously.
C. Point
Specifically for point geometries, projects frequently require the creation of categorized symbols instead of relying solely on simple colored shapes. The following steps outline the process for configuring these categorized symbols:
Keywords
layer, symbology, sublayers, polygon, polyline, point, name, description, source, selectable, preloaded, center, view, for, bounds, draw