2.1.2 Series
Series walks through map features one at a time and shows attribute-driven content for each pivot value. Planning teams often use it to present parcel, block, or zone guidelines in sequence.
This tool iterates over each layer feature to display detailed attributes. Planning documents frequently utilize this function to establish a complete overview of specific subset areas, including parcel and sub-block guidance.
A. Create a New Series
To create a new series, you required to have layer for pivotal point of the series. This is the following steps to create a new series:
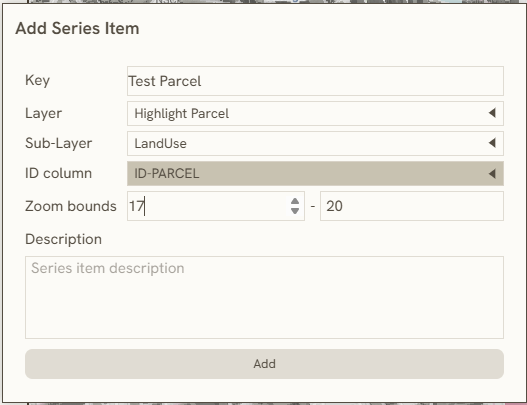
- Click

button to add a new series. 2. Enter the name of your series in the Key field. 3. Choose the source map Layer from the dropdown menu. 4. Select the appropriate ID Column to serve as the pivotal reference point. 5. Adjust the Zoom Bounds to establish your starting view point and maximum zoom scale. 6. Write a brief text summary detailing your series project in the Description field.
B. Edit Content in Series
Embedded within the 1.1.7 Island Bar (Right Bar) and built using Markdown format writing. This tool describes the data attributes of individual shapes. In urban planning and design contexts, it is specifically used to display guidelines for respective parcels or sub-blocks.
Use the Markdown Editor to write formatted text, tables, and expressions that change as you step through each feature in the series.
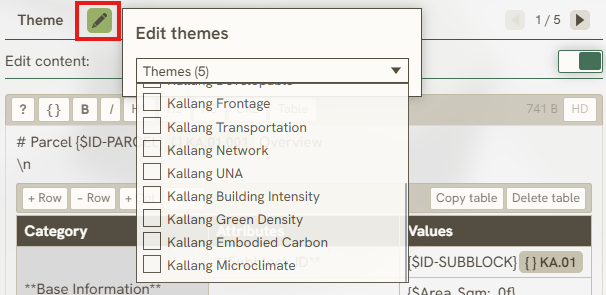
C. Series based on Theme
You can also sort and organize the display data based on your specific Themes (2.1.3 Themes) by clicking the edit button. By selecting multiple themes to include in a Series, the reference point will dynamically display its respective data and zoom factor across each theme you selected.
Keywords
series, create, new, edit, content, based, theme, key, layer, column, zoom, bounds, description, themes, 2 1 2