2.1.4 Layers
The Layers tool controls everything drawn on the map: layer order, grouping, visibility, styling, and attribute editing. Use it to connect datasources to the project and manage how each dataset appears — including go to bounds, layer to top, select only, opacity, Layer Symbology, and Markdown Table.
A. Create a New Layer
There is 2 methods to create a new layer, the first one is from 2.2.2 Datasources and the second one is drag the spatial data directly on map.
From 2.2.2 Datasources: Once your data is uploaded, you can access it in the Layers tab.
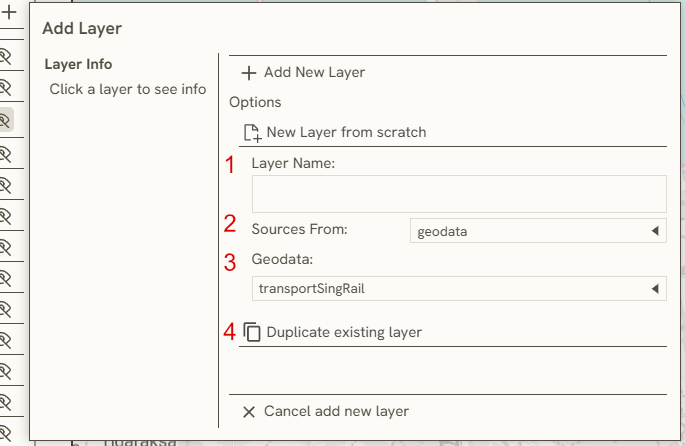
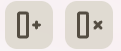
- First, you click
to add a new layer and
to create a new folder of layers 2. When you click it, you will be required to enter a Layer Name.
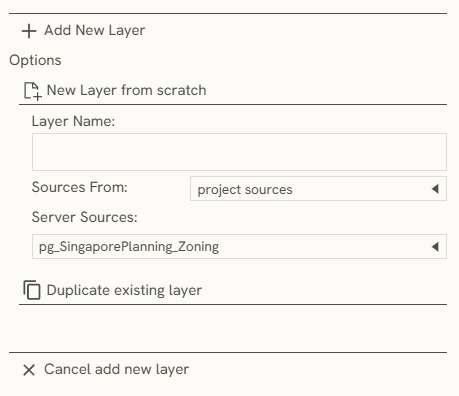
- In the Source From, you can select several sources based on the data-type
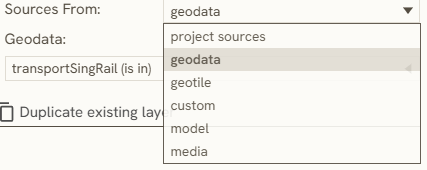
**Project sources**: using data from existing project
**geodata**: geospatial data (.gpkg)
**geotile**: raster data
**model**: 3d modelling
**media**: All the data that available in [2.1.6 Docs](/docs/2-project-tools/2.1.6-docs)
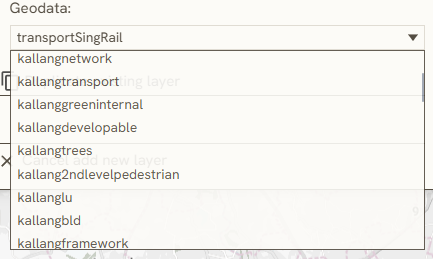
After you choose the **data-type** a new row will appear, and then click the layer that you will use as a layer
- A new layer can also be added by re-using an existing layer from the currently open project.
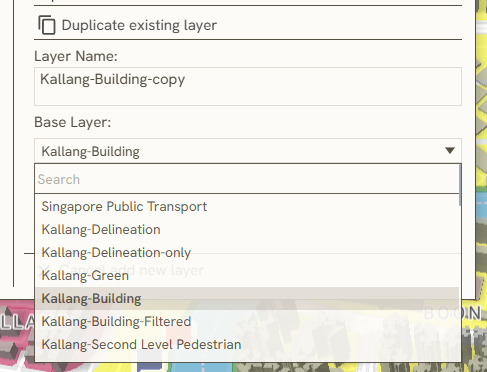
By Drag&Drop: In the second method, you can simply drag your file into the map, it also can be used on 3d Modelling. The file automatically showed on the layer's list, if the spatial data is correctly geolocated, the data will showed into the map while you switch on the layer.
B. Layer Symbology
Open Layer Symbology from the 1.1.7 Island Bar (Right Bar) to paint polygons, lines, and points, configure sub-layers, and edit the map legend for the selected layer.
C. Table
This tool will help you to edit & manage data attribute of specific layer.
There are several functions that used on this tool:
Editing Tool : same as in 2.1.8 Feature Info, this function enables the direct modification of attribute data within the selected layer, utilizing a dropdown menu system to easily select and apply existing values from the column.
Filter: This function filters the dataset based on the text entered directly into the Filter bar.
Field Calculator: This tool executes basic mathematical operations, string manipulations, or geometric expressions directly on a vector layer's attribute data.
Add or Remove Attribute Field: This function enables the addition or deletion of attributes; specifically, when utilizing the Add Attribute Field feature, defining the data type and maximum field length is required before the new column can be created.
D. Select Only
Enabling this tool restricts the selection tools to capture only features within this specific layer.
E. Change Opacity
Adjust layer opacity using a slider scale from 0 (0%) to 1 (100%).
F. Layer to Top
This tool helps you instantly rearrange the layer hierarchy by moving the selected layer to the top. The video demonstrates the labels within the layer hierarchy:
G. Go to Bounds
This tool rearranges the camera view to fit the boundaries of the selected layer.
H. Basemaps & Sources
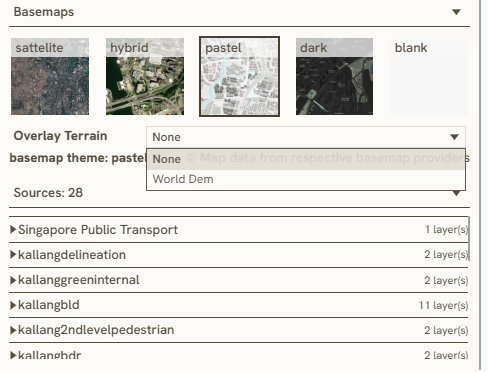
Basemap: This section assists in selecting an available basemap, operating identically to 1.1.3 Basemap Selection. Additionally, it includes a Terrain Overlay option to display existing, real-world topography utilizing global digital elevation models (World DEM).
Sources: This section displays specific metadata regarding the datasource, as well as the total number of layers utilizing that specific datasource.
Keywords
layers, create, new, layer, symbology, table, select, only, change, opacity, top, bounds, basemaps, sources, from, datasources