2.1.12 Sun Duration Analysis
Sun-duration analysis measures the direct sunlight a location receives over time by modeling solar angles against surrounding obstacles.
The analysis uses your currently visible layers as its input data, treating all active buildings and terrain in your viewport as shadow-casting barriers.
A. Period & Settings
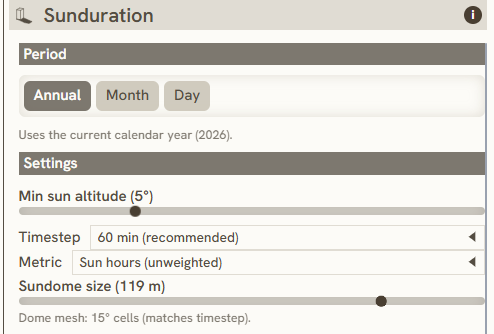
In Sun-Duration Analysis, you need to specify the analysis Period as well as detailed Settings for minimum sun altitude, timestep, sundome size, and metrics.
Under Period, choose between Annual, Monthly, or Daily analysis. For example, an Annual analysis calculates the average sun duration for each hour across 365 days.
Below are the configurations required for Settings:
-
Min Sun Altitude (5°): Sets the minimum sun angle threshold for the analysis.
-
Timestep: Specifies the time interval used for calculations.
-
Metric: Defines the specific measurement output.
-
Sundome Size: Controls the size of the simulated sky dome.
B. Analysis
Manual draw
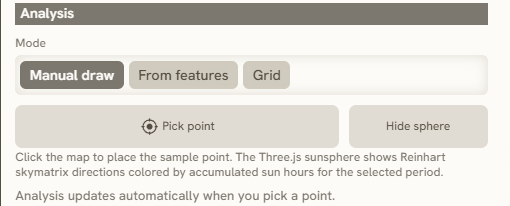
To run this analysis in Manual Draw mode, you will select a specific point directly on the map to calculate its sun duration. The calculation will use all visible layers on your screen as the base data.
From Features
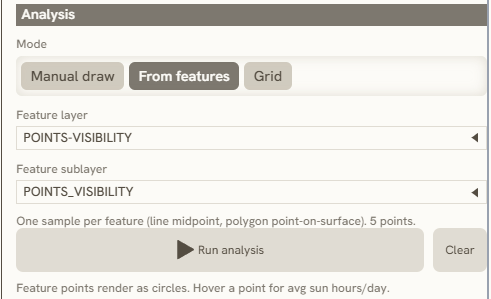
While Manual Draw allows you to select a specific point directly from the map, From Features enables you to select and analyze multiple points simultaneously using an existing layer from your project.
Grid
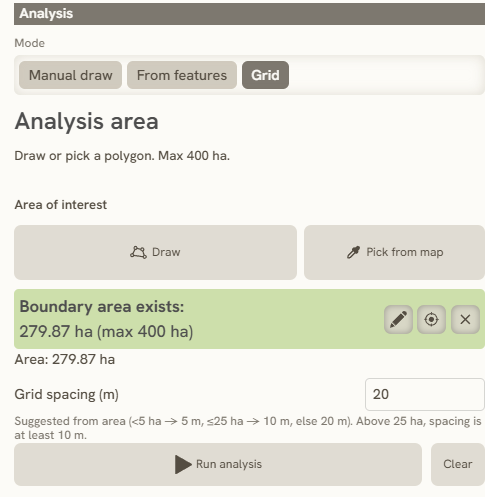
Unlike point-based methods, Grid Mode evaluates sun duration across an entire surface area.
To use this tool, draw a polygon over your target area; the system will generate an evenly spaced grid of points within the boundary and analyze the sun duration for each point across the site.
C. Data Result
Highlighted Metrics
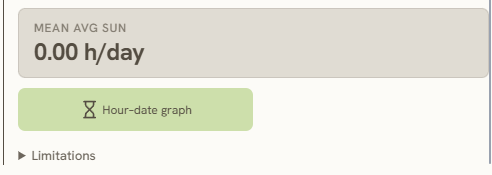
In this section, the result is displayed as the mean value of the average sun duration. For example, if you select Annual analysis, it will display the mean average sun duration over the course of a year from the selected point.
Hour-date Graph
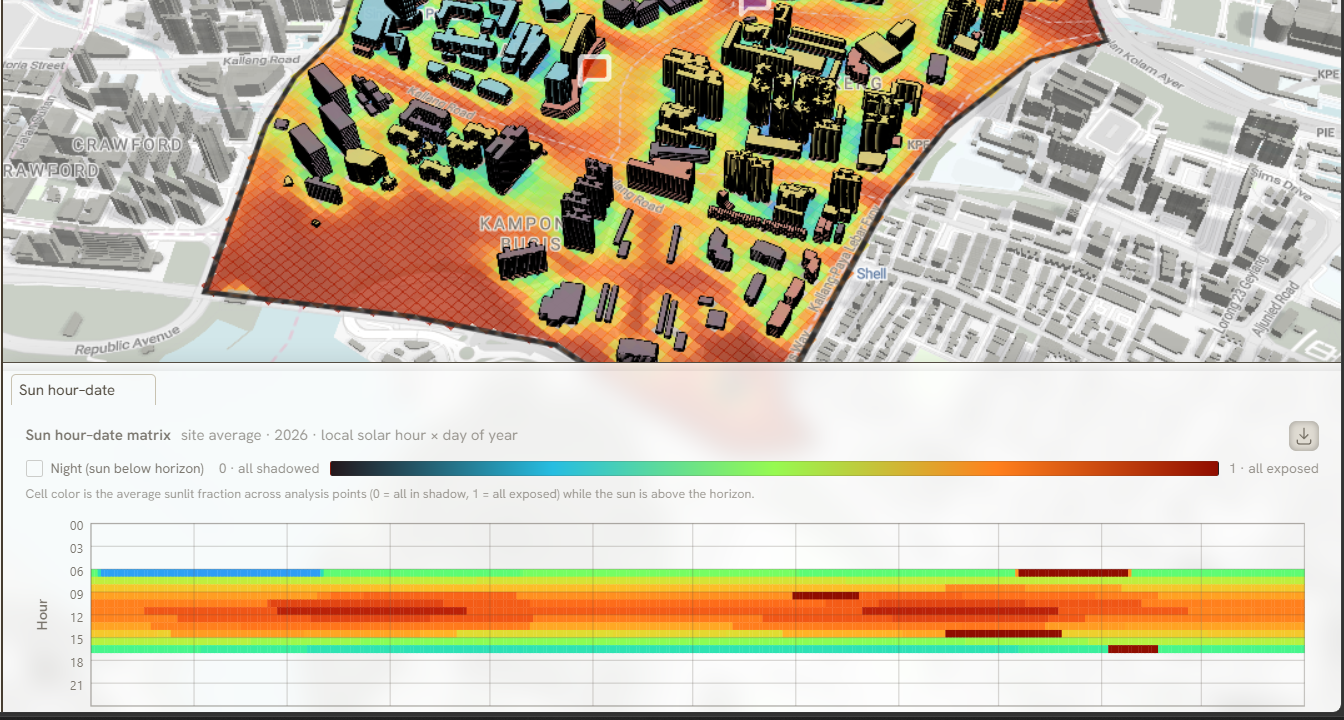
Think of this graph as a custom sunshine calendar for your site. It plots every hour of the day against your chosen date range, using color to show sunlight intensity. Darker blue shades mean full shade or nighttime, while bright reds indicate maximum direct sunlight, giving you a quick snapshot of when your site gets the most sun.