2.1.13 Visibility Analysis
This tool evaluates 360° visibility by generating an isovist from a selected observer point.
It uses blocking layers, including both basemap structures and added layers, as physical visual obstacles. The analysis outputs an effectiveness score as a percentage of the full 360° (100%) field of view.
A. Blocking Layers & Parameters
Blocking Layers
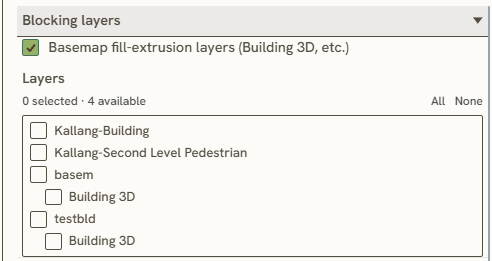
At the very beginning, you need to define Blocking Layers as your based source before you run the Visibility Analysis. It because the analysis need physical obstacle to calculate the Visibility Index
Parameters
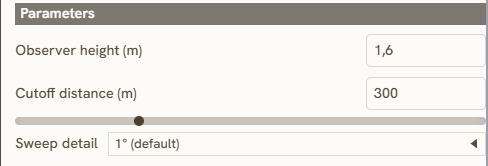
In the Parameters section, adjust the Observer Height to represent your desired viewing level (for example, 1.6 m for a standard human eye-level perspective). The Cutoff Distance defines the maximum sightline radius from the observer point.
The Sweep Detail determines the angular resolution of the analysis; set to 1°, the tool casts sightlines at every 1-degree increment around the observer, resulting in 360 rays for maximum precision.
B. Analysis
Manual Draw
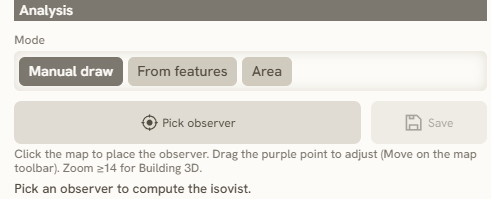
This mode allows you to pick an observer location directly on the map interface. Once selected, the tool automatically computes the Isovist and outputs the corresponding visibility index for that point.
From Features
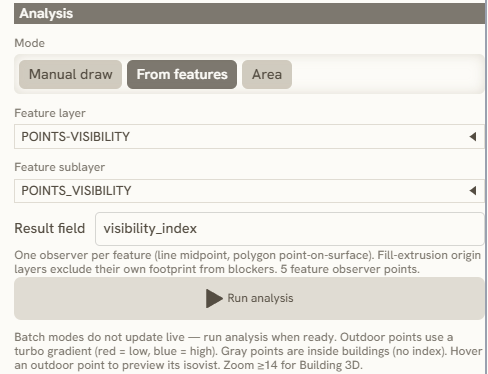
While Manual Draw allows you to select a specific point directly from the map, From Features enables you to select and analyze multiple points simultaneously using an existing layer from your project.
Area
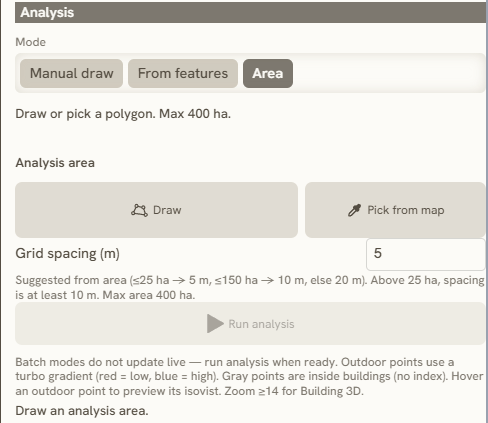
Unlike point-based methods, Area Mode evaluates visibility analysis across an entire polygon area. To use this tool, draw a polygon over your target area; the system will generate an evenly spaced grid of points within the boundary and analyze the visibility analysis for each point across the site.
If you already have an polygon in your layer, toggle the layer on, click the
button, and select the layer's polygon.
C. Result
Visibility Index
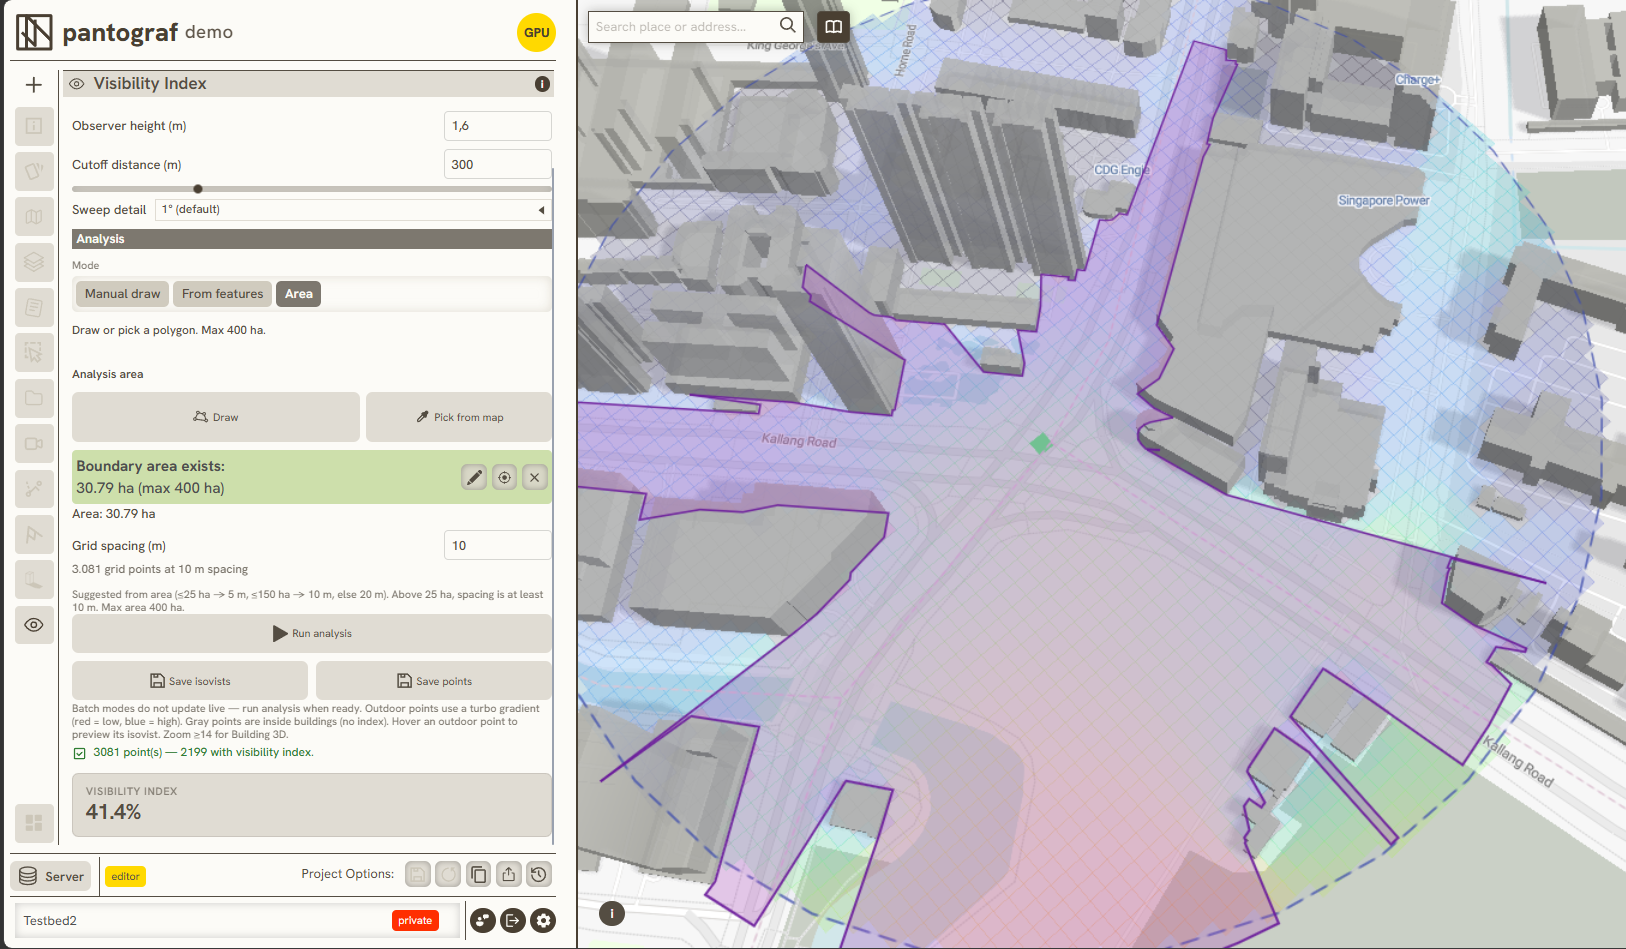
When the analysis completes, the system updates the map with the visual isovist and generates a visibility index metric for the point.
In this example, the 44% result indicates that only 44% of the total 360° field of view reaches the full cutoff distance without hitting physical obstacles.
Analysis Report
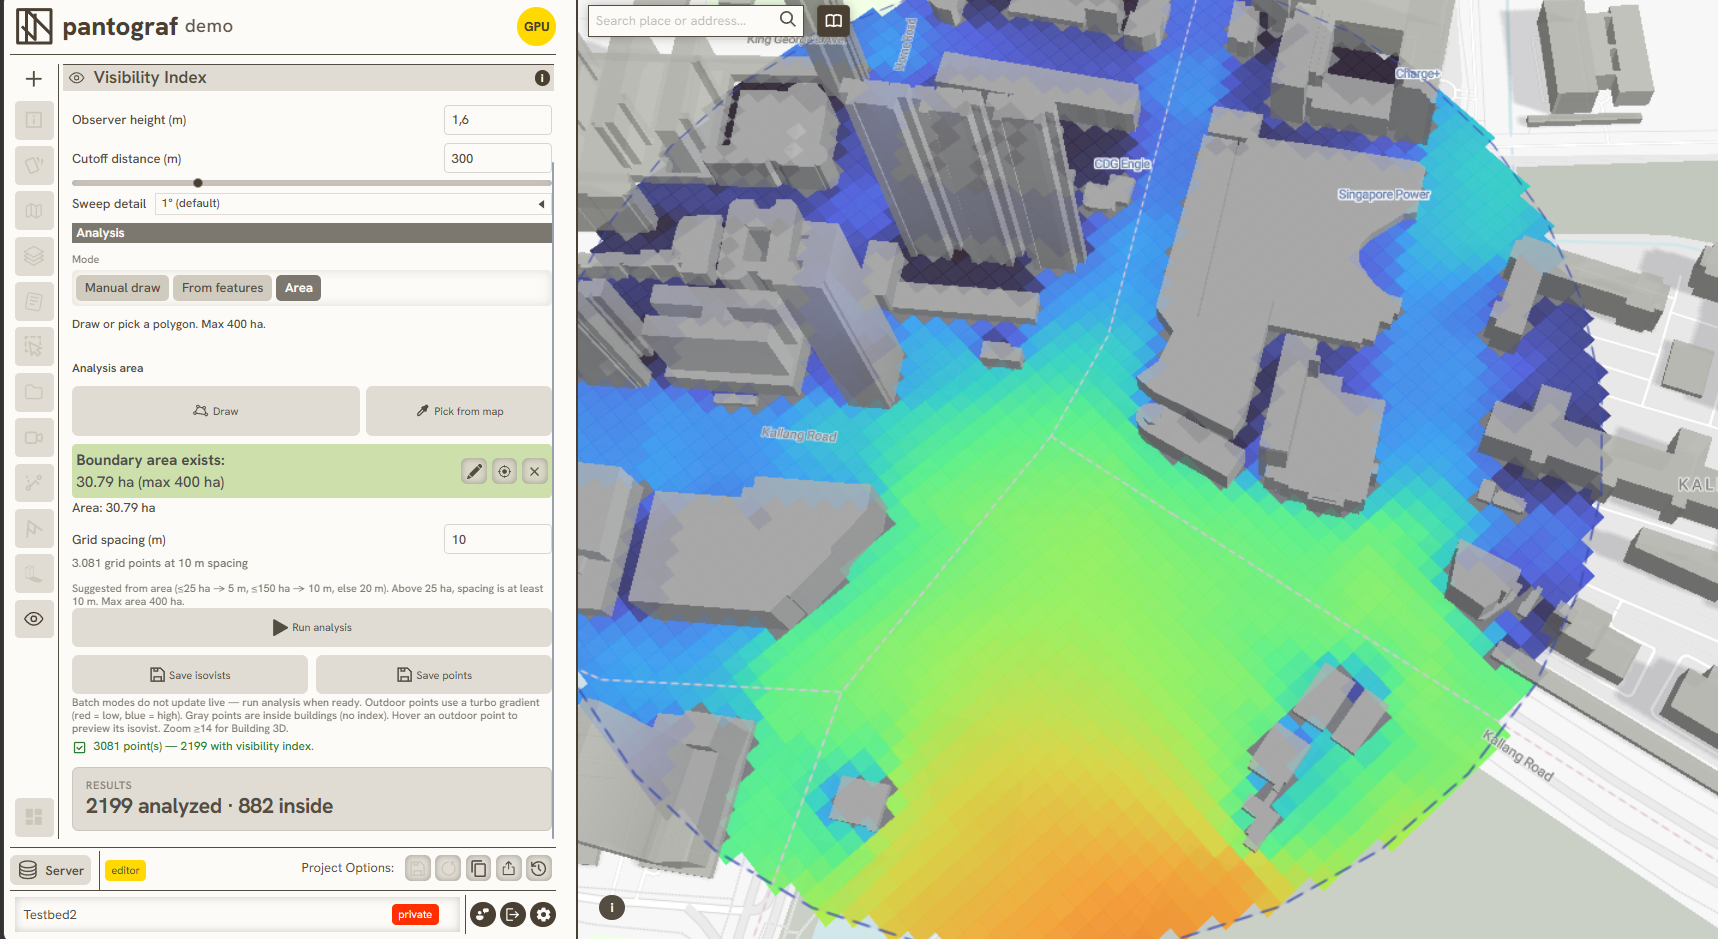
In Area Mode, the tool displays the total number of analyzed points and highlights any points located inside physical obstacles like buildings.
The system automatically generates a color range legend for the results. You can also download the grid and customize its color range using the 2.3.1 Layer Symbology settings.